Every application is purpose-built for a specific mission and runs on your Foundry instance
Browse
Continuously monitors thousands of assets across your fleet, connects sensor anomalies to operational context, and surfaces every fault pattern before it becomes a failure, reducing mean time to detect by 70% without drowning your teams in noise.
Most monitoring tools generate more noise than signal. The real challenge isn't detecting anomalies, it's knowing which ones matter in context. But the deeper problem is adoption: if the alert workflow doesn't match how your team actually responds to events, they build workarounds and the system gets ignored. The real challenge isn't building a dashboard; it's building the correlation engine that connects vibration spikes to load shifts to maintenance history, and surfaces the pattern your engineers would spot if they had time to look.
Ingests your SCADA, historian, and CMMS data to build a foundation that reflects how your operation actually runs
An AI correlation engine tuned to your fleet's specific failure modes, so alerts carry context your engineers already trust
Every alert opens into full context: sensor trends, maintenance history, and recommended next steps
The same data foundation grows with you, into predictive maintenance, spare parts optimization, and regulatory compliance

Connects your cost, schedule, and risk data into a single live cockpit, so every program variance is visible, explained, and actionable before it reaches the review room.
Most programs have the data. The problem is that cost performance, schedule variance, and risk indicators live in separate systems, updated on different cadences, owned by different teams. By the time someone assembles a coherent view, it reflects last week's reality. The deeper challenge is that EVM is only useful when it's connected to what's actually driving variance. The cockpit has to surface that context automatically, not require a finance analyst to reconstruct it from five different reports before every IPR.
Ingests your EVMS, scheduling tools, and ERP data to build a single performance foundation that reflects how your programs are actually running
An AI-driven variance engine that connects cost and schedule deviations to their root causes, so your finance team is explaining decisions rather than chasing numbers
Every program opens into full context: S-curve trends, WBS element health, recommended actions, and CPR-ready outputs in one view
The same data foundation extends to IPMR and CPR reporting, risk reserve analysis, and portfolio-level performance visibility across all contracts
.jpg)
Screens inbound deal flow against your fund criteria, benchmarks each opportunity against historical comps, and cuts diligence time by 50-60% without adding headcount.
Most extraction tools are built for clean, structured data but real CIMs are narrative, partial, and inconsistent. Getting reliable metrics out of actual deal flow is unsolved for most teams. But the deeper problem is adoption: if the output doesn't reflect how your analysts already evaluate a deal, they ignore it.
Shaped around how your fund actually evaluates deals (the criteria, the comp logic, the IC format) not the other way around
Weeks to a working system, not a multi-quarter programme your team waits on
Every pipeline built for screening becomes the foundation for DDQ, IC prep, and portfolio monitoring - the second use case is always faster than the first
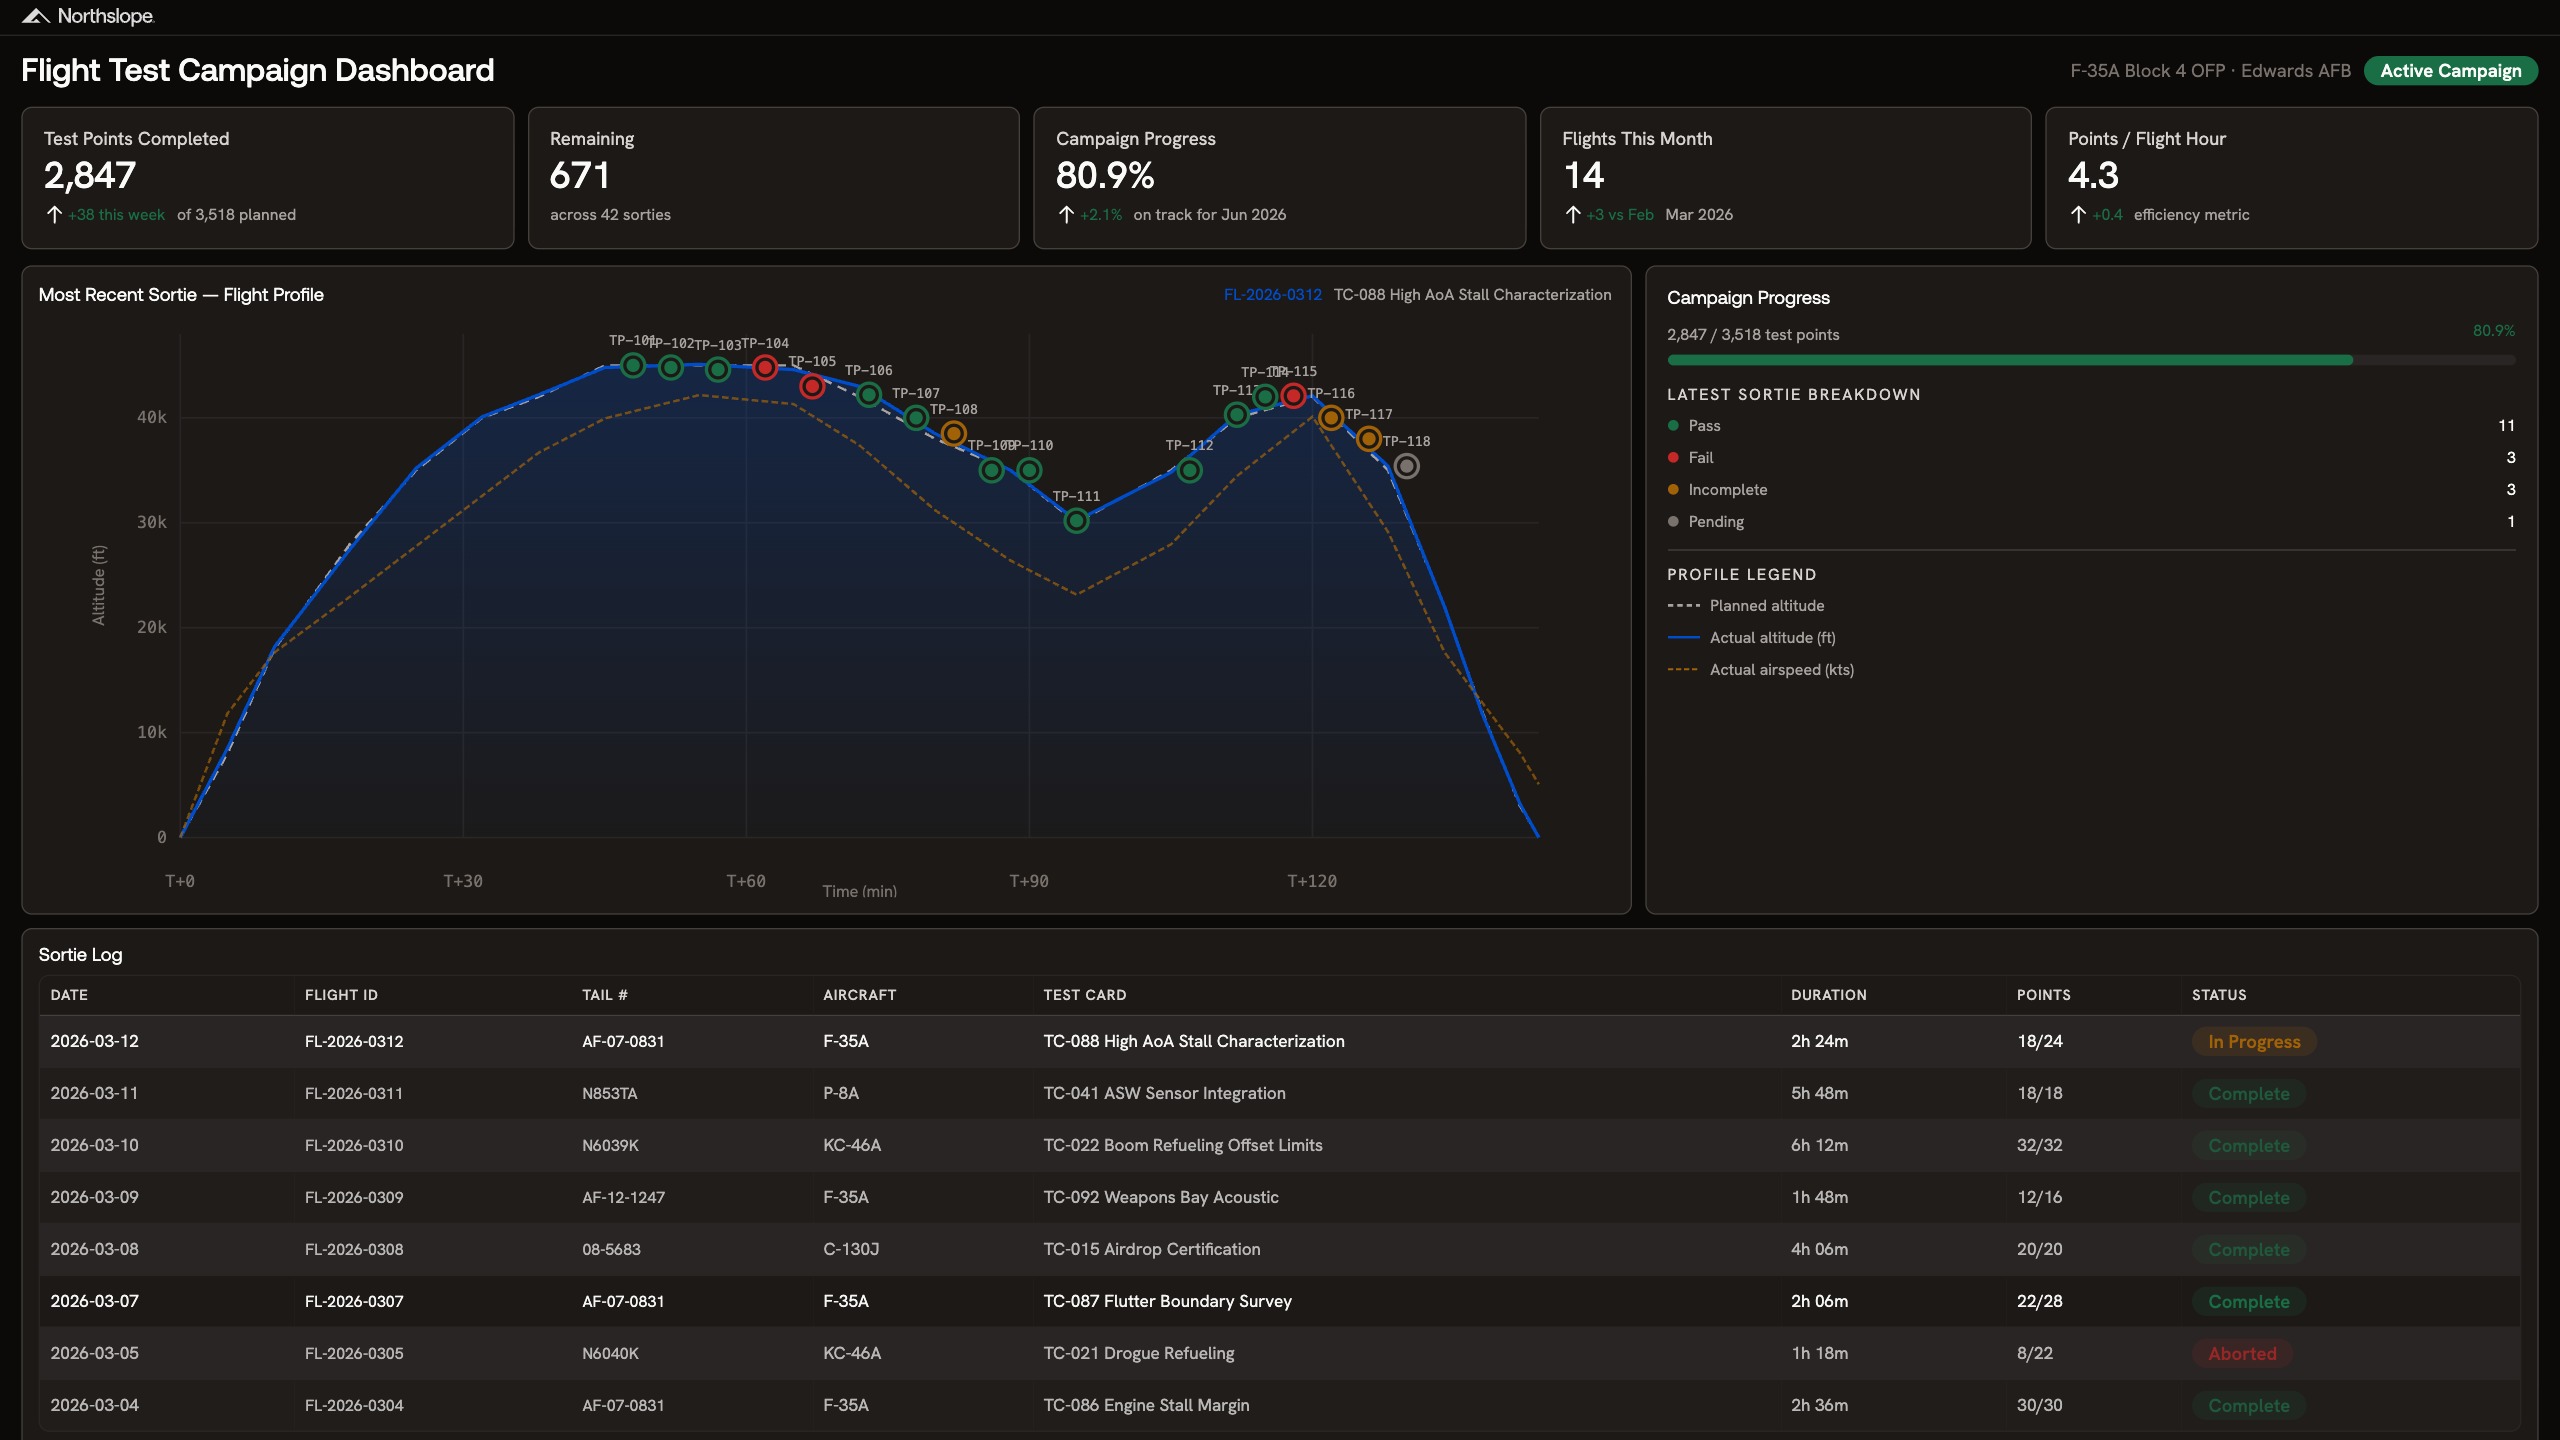
A flight test campaign dashboard that tracks test point completion, sortie efficiency, and campaign progress across aircraft and test cards. Overlays planned vs. actual flight profiles, flags incomplete and failed points, and gives program leads real-time visibility into schedule risk.
Test campaign management is a scheduling, sequencing, and resource coordination problem with almost no margin for error. Test cards have dependencies and you can't fly envelope expansion until stall characterization is complete. Aircraft availability, weather windows, range scheduling, and crew qualifications all constrain what can fly on any given day. When a sortie comes back incomplete or a test point fails, replanning cascades across the entire campaign. Most programs track this in spreadsheets and PowerPoint, reconciled manually after every flight.
Configured to your test card structure, aircraft fleet, and sortie planning process
Weeks to production, not a multi-quarter tool deployment your test team waits on
Real-time sortie efficiency metrics replace manual post-flight reconciliation
The same foundation extends to DT&E reporting, deficiency tracking, and milestone readiness reviews
.jpg)
A technician copilot that connects work orders, asset history, alarm data, and parts inventory into one shift view. Prioritizes tasks by asset criticality, sequences jobs to minimize travel and downtime, and confirms parts are staged before dispatch.
Alarm data, sensor readings, and maintenance history live in separate systems and hence failure patterns that predict breakdowns never surface. Even when they do, acting on them is a separate problem: work orders, parts availability, and technician schedules sit in a different system entirely, and past repair history for a specific asset is buried or incomplete. Predictable failures still cause unplanned downtime because detection and execution aren't connected.
Built against your asset hierarchy, ERP, and alarm history rather than a generic CMMS overlay
Flags parts approaching failure before the work order is raised: condition-based, not calendar-based
Technicians work in their existing tools and the right context surfaces when they need it
The same data foundation extends to inventory optimization, procurement, and supplier analytics

An AI scheduling optimizer that generates shift schedules across departments, forecasts demand by unit, and auto-resolves coverage gaps while respecting certifications, overtime limits, and staff preferences. One-click approve and publish.
Scheduling staff members across multiple departments isn't a calendar problem rather a constraint satisfaction problem. Certifications, union rules, overtime caps, back-to-back restrictions, float pool eligibility, and individual preferences all interact. A single swap can cascade into three violations. Most scheduling tools let managers move tiles around; none encode the full rule set so the system can solve it. Every health system's constraints are different, which is why charge nurses still spend hours rebuilding schedules by hand.
Encodes your union rules, certification matrix, and overtime policies — not a generic template
Weeks to production, not a multi-quarter workforce management rollout
Demand forecasting adapts to your census patterns, not industry averages
The same foundation extends to float pool optimization, agency spend reduction, and retention analytics

A stocking decision engine that ranks every spare part by stockout risk and asset criticality. Shows consumption history, lead time variability, and which assets depend on each part along with AI-driven reorder recommendations and cost impact for every decision.
The first challenge is that consumption history, supplier lead times, and asset criticality live in three systems with no shared key. The harder problem is encoding the decision logic: how much stockout risk is acceptable for this asset class, when does overstocking cost more than the risk it mitigates, and how should reorder points shift as consumption patterns change. That logic is different for every facility, and it lives in planners' heads rather than in any system. Building software that captures it, keeps it current, and earns enough trust that planners actually use it is the real challenge.
Linked to your asset hierarchy, ERP, and actual supplier lead times — not catalogue defaults
Weeks to production, not a multi-quarter inventory system overhaul
Every recommendation shows stockout risk, cost impact, and which assets are exposed
The same foundation extends to procurement spend analysis, obsolescence tracking, and supplier analytics
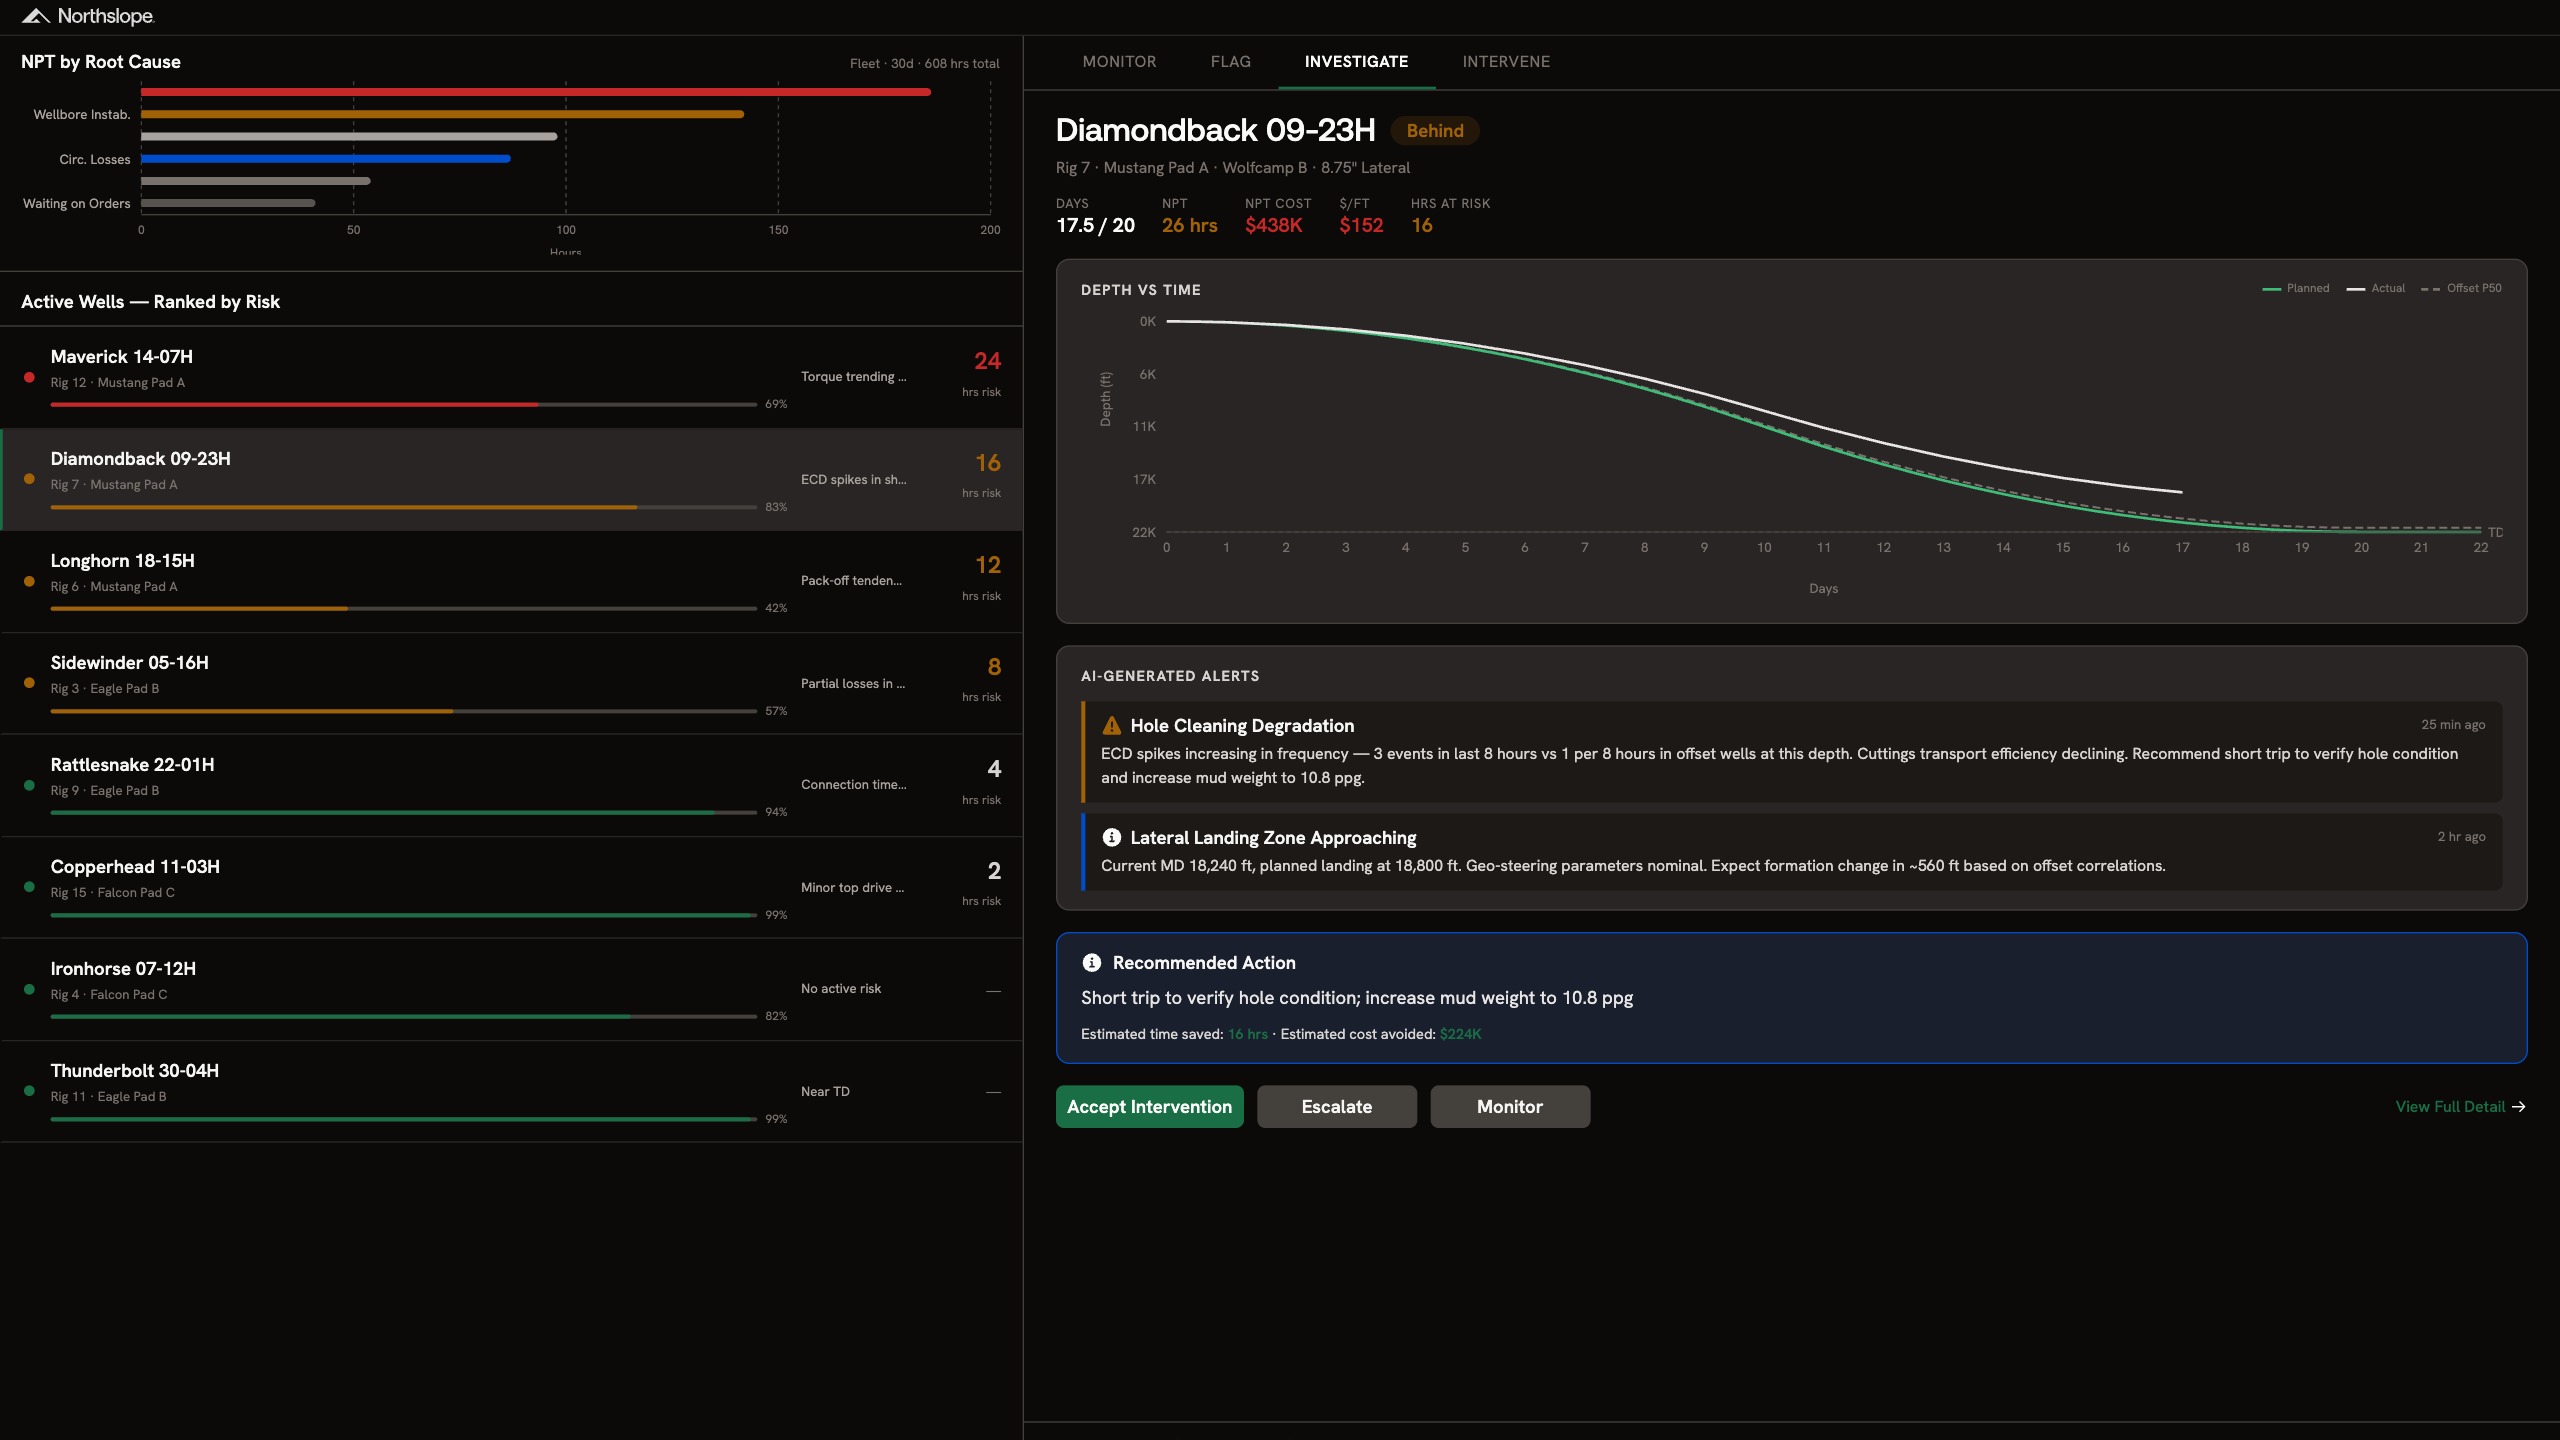
A real-time drilling surveillance platform that ranks active wells by risk, correlates downhole parameters against offset well data, and generates AI-driven intervention recommendations with estimated time and cost savings attached.
Every well has a different formation, different BHA, different offset history. Recognizing that an ECD spike at 18,000 ft means hole cleaning degradation requires correlating real-time parameters against offset wells in the same formation, not just threshold alerts. Building that correlation engine means ingesting WITSML feeds, mud logging data, and geological prognoses into a model that understands your specific basin and well design. Off-the-shelf drilling analytics tools give you dashboards. They don't give you interventions tuned to your operations.
Models trained on your basin, offset wells, and well designs rather than generic drilling benchmarks
Weeks to production, not a multi-quarter analytics deployment
Every recommendation includes estimated time saved and cost avoided
The same data ontology extends to well planning, post-well analysis and any new tools
.jpg)
A pipeline outage planner that sequences scheduled maintenance, emergency repairs, and ILI runs across your system in a single 48-hour timeline. Shows capacity cuts, revenue at risk, shipper exposure, and linepack buffer for every scenario along with crew, permit, and window status attached.
Outage scheduling is a multi-constraint optimisation problem disguised as a calendar. Every outage affects capacity, linepack, shipper commitments, and firm contract exposure differently depending on sequence and timing. An emergency leak repair forces rescheduling of three downstream jobs, each with different crew availability, permit windows, and OFO risk. Planning tools show you the timeline. They don't model the commercial and operational tradeoffs of resequencing it.
Configured to your pipeline segments, shipper contracts, and permit windows rather than a generic scheduler
Integration with your SCADA, GIS, and nomination systems
Weeks to production, not a multi-quarter planning tool rollout
Every sequencing decision shows revenue, capacity, and linepack impact before you commit
The same foundation extends to integrity management, turnaround planning, and regulatory compliance
.jpg)
A live risk command center that monitors VaR, concentration, drift, and factor exposures across your portfolio. Surfaces breaches as they happen, proposes trade-level rebalancing actions with estimated impact, and sends directly to your OMS.
Risk monitoring and portfolio execution have always lived in separate systems, owned by separate teams, on separate cadences. A VaR breach surfaces, someone exports it, writes up a recommendation, and routes it for approval. By the time a trade hits the OMS the market has moved. The deeper problem is that risk signals without trade context are just noise. Knowing your EM allocation is 1.1% over target doesn't tell you which sleeve to trim, what the Sharpe impact will be, or whether the fix creates a new problem elsewhere in the portfolio. That analysis has to happen automatically, against live positions, before anyone picks up the phone.
Connects directly to your OMS, risk engine, and position data so the platform adapts to your workflow and reflects your live book
A correlation engine that traces every breach back to its root driver, whether concentration, factor exposure, or drift, and proposes the minimum intervention needed to resolve it
Every risk alert opens into full context: stress scenario impact, allocation drift, factor exposures, and executable trade instructions in one view
The same foundation extends to regulatory reporting, investment committee packs, and intraday limit monitoring across your full fund range
.jpg)
A store-level workforce optimizer that scans demand signals, call-outs, BOPIS surges, and DC delays across your fleet. Flags at-risk stores by coverage gap, recommends rebalancing actions by role area, and generates approvable plans with overtime and cost impact attached.
Store coverage is a cascading tradeoff problem, not a staffing problem. Fixing one gap usually creates another: like pulling a floor associate to BOPIS drops cashier coverage, extending a shift triggers overtime. Every store has a different demand pattern, role mix, and set of constraints that change by the hour. Most workforce tools show you the gap but none resolve it.
Configured to your labour model, role certifications, and scheduling rules, not a generic template
Weeks to production, not a multi-quarter workforce management rollout
Recommendations account for overtime cost, associate preferences, and service level impact
The same foundation extends to labour forecasting, shrink correlation, and store clustering

A margin analytics platform that decomposes gross-to-net across COGS, trade spend, freight, fulfillment, and deductions and isolates the primary cost driver behind every margin decline, and recommends corrective actions with estimated margin recovery per move. Recovers margin on underperforming SKUs within the first review cycle.
Allocating costs accurately to the right SKU, channel, and transaction is where every margin tool breaks down. Trade spend hits at the invoice level but needs attribution at the SKU level. Fulfillment costs differ by channel but most systems don't split them. Deductions get written off in bulk instead of disputed line by line. Building a true gross-to-net waterfall per SKU means defining allocation logic that matches how your business actually recognises cost and that logic is different for every retailer, every channel, and every category.
Mapped to your GL structure, channel mix, and trade spend logic, not a generic P&L template
Weeks to production, not a multi-quarter BI implementation
Every recommendation shows estimated margin impact at the SKU and category level
The same foundation extends to supplier negotiation, assortment analysis, and pricing analytics

A safety impact response center that ingests FDA recalls, contamination alerts, sterility failures, and temperature excursions into one prioritised view. Automatically maps affected patients and cases, tracks containment status, and assigns response owners.
When a recall or contamination event hits, the response is a coordination problem across supply chain, clinical, pharmacy, and quality teams. Each team has different urgency, different information needs, and different systems. Mapping the blast radius (which patients, which units, which cases) requires logic that's specific to your supply chain structure and clinical workflows. Containment status has to be tracked in real time across teams that don't share a system. Most organisations run this on email chains and spreadsheets because no tool has encoded their actual response process.
Configured to your event taxonomy, escalation paths, and regulatory reporting requirements
Weeks to production, not a multi-quarter compliance program
Connects supply chain, surgical logs, and patient records to identify the blast radius
The same foundation extends to adverse event reporting, audit readiness, and root cause tracking

A risk-stratified utilization review worklist that connects payer rules, clinical documentation, and review deadlines into one view. Auto-prioritises cases by denial risk, flags missing docs before deadlines, and cuts diligence time by 50–60%.
The data needed to risk-stratify a case lives across your EMR, payer portals, and clinical documentation with no shared schema. Every health system has different payer contracts, review timelines, and escalation criteria, and they change quarterly. Building a working rules engine means mapping all of that to your specific workflows. Generic tools skip this step, which is why adoption fails.
Shaped around your payer mix, review criteria, and escalation paths rather than a generic template
Weeks to a working system, not a multi-quarter implementation your team waits on
Plugs into your EMR and existing workflows so that your nurses don't learn a new tool
The same foundation we build extends to denial management, appeals tracking, and length-of-stay analytics

An inventory control tower that connects demand forecasts, safety stock levels, and PO schedules across every location. AI-driven recommendations flag excess stock, rebalance across sites, and adjust thresholds with projected savings attached to every action.
Excess inventory doesn't announce itself. It builds gradually across locations, obscured by forecast assumptions nobody has revisited and safety thresholds that made sense at a different volume. By the time it surfaces in a finance review, the working capital is already locked up. But the deeper problem is execution: most tools can identify the excess. Very few can do anything about it. A recommendation that can't reach your ERP, trigger a PO deferral, or notify a supplier is just another item on a list that someone has to manually action across three different systems before the stock moves anywhere.
Connects directly to your ERP, WMS, and demand planning tools so the platform adapts to your workflow not the other way round
An AI recommendation engine that identifies excess stock, cross-location imbalances, and at-risk SKUs before they become write-offs, with estimated working capital impact for every action
Every recommendation comes with a proposed execution path: purchase order deferrals, inter-location transfers, and supplier notifications that can be approved and sent directly from the platform
The same foundation extends to demand forecasting, supplier performance monitoring, and network-wide scenario planning as your deployment grows